Too Hot to Handle
By: Aaron Eling
By: Aaron Eling
Project at a Glance :
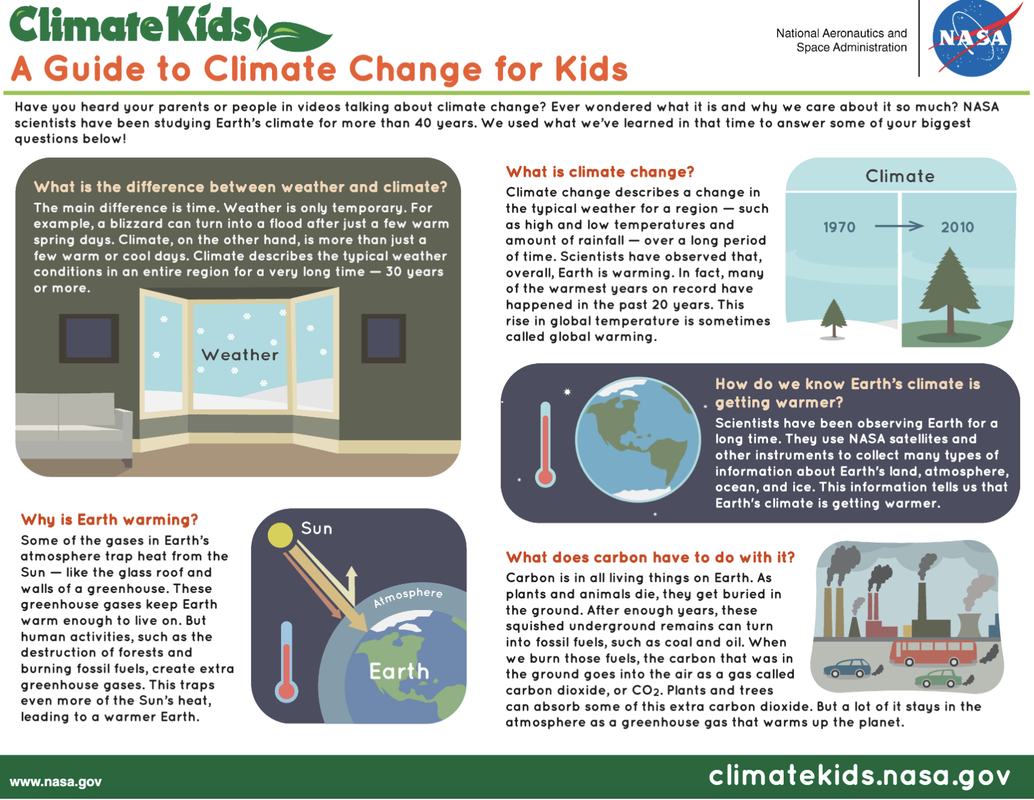
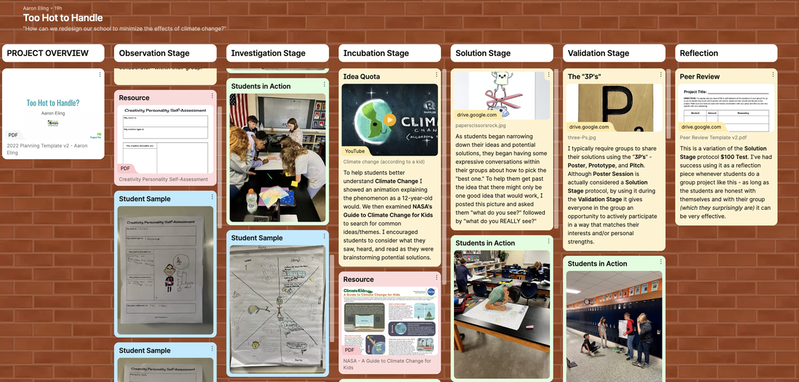
How do humans modify physical environments? This is a question posed in our 6th grade social studies unit on Human Environment Interactions. In this project, students will learn about the Urban Heat Island phenomenon and the effect it has on climate and climate change. The purpose of this project is to incorporate Project Based Learning (PBL) into our existing social studies curriculum in a way that is both meaningful and impactful to others. I plan on implementing this project within the first few weeks of school when the building, which has no air conditioning, is unbearably hot. The project should take about two weeks due to the shorter class periods.
Driving Question:
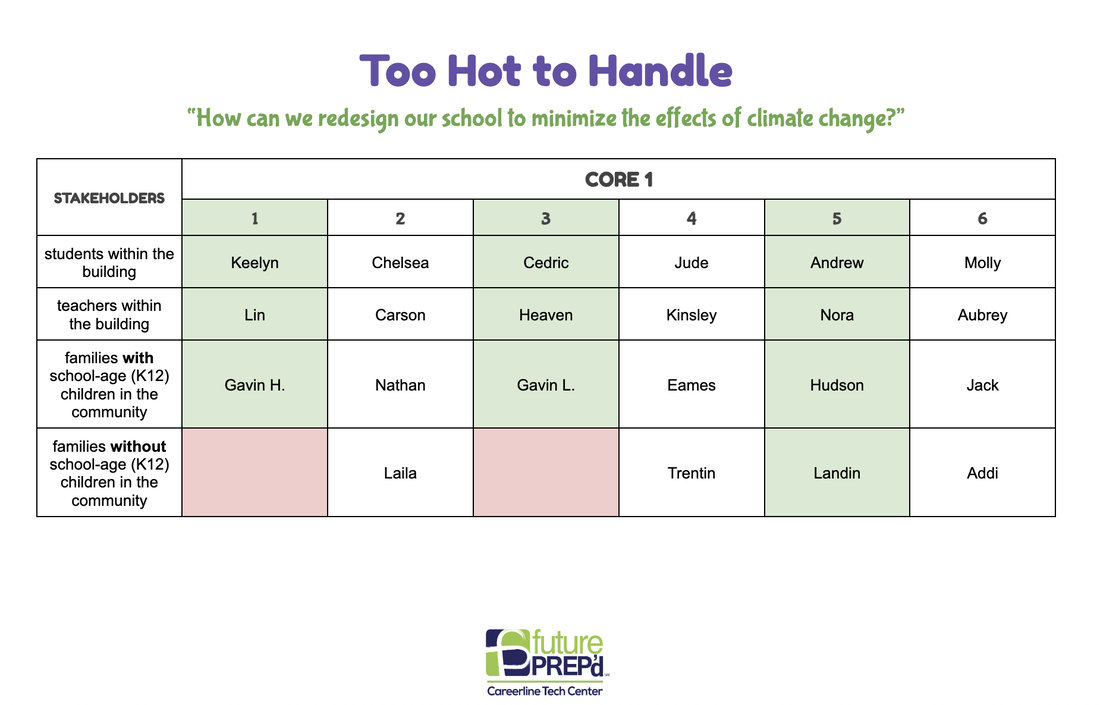
How can we redesign our school to minimize the effects of climate change?

Standards:

Entry Event:
|

Stakeholders:
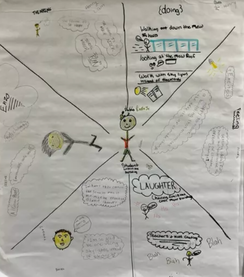
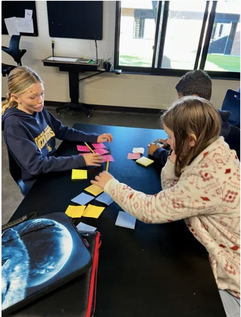
Empathy Building:
|

Incubation:
|

Solution Building:
|

Authentic Audience:
|

Click here for teacher's full plan.
Reflection and Feedback:
|
Click here for the teacher's Journey through PBL on Padlet . . .
|
Meet the Educator:
Aaron Eling teaches 6th grade Science and Social Studies at White Pines Intermediate School in Grand Haven, MI. “My goal is to help my students shift from being passive users to active creators and help them understand how STEAM and PBL in the classroom can lead to positive change in the real-world.” |

|